
Hellopeter
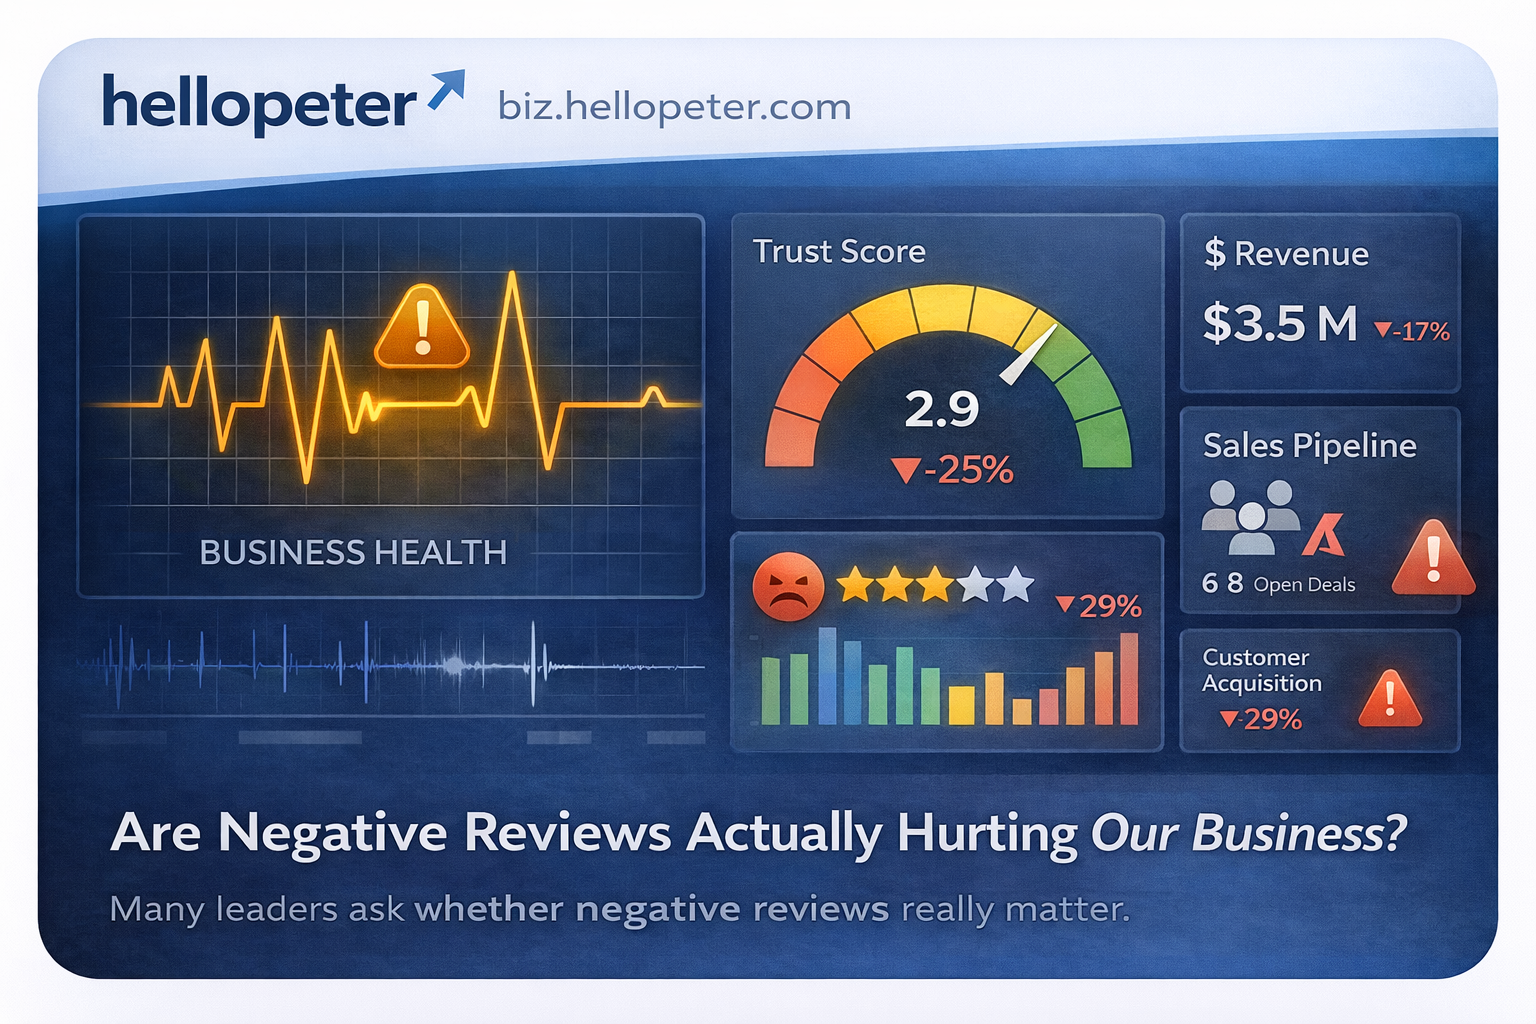
This is one of the most common questions leadership teams ask when evaluating whether to invest in reputation management: "Are negative reviews actually hurting our business?"
It's a valid question. Revenue continues flowing. Customers keep buying. The sales team closes deals. Operations run. On the surface, business appears unaffected by occasional negative reviews visible on Hellopeter and other platforms.
This question reflects a reasonable desire for evidence before committing resources to addressing something that might be merely perception rather than material business impact.
The challenge is that the real impact of negative reviews rarely appears in isolation or as a line item in financial reports. Instead, they create friction, invisible drag on conversion rates, sales efficiency, customer acquisition costs, and growth velocity that manifests gradually rather than catastrophically.
This article helps leadership teams answer the question "are negative reviews hurting us?" by examining where impact actually shows up, what signals indicate reputation damage is affecting business outcomes, and how to assess whether your specific business is experiencing reputation-driven friction.
Understanding what negative reviews really cost businesses provides the framework for this assessment.
Why the Impact Is Hard to See
Before exploring where to look for reputation impact, it's important to understand why the damage from negative reviews is difficult to recognize without systematic analysis.
Negative Reviews Influence Decisions Before Sales Conversations Happen
Here's what happens:
A prospect identifies their need and begins researching solutions. Your business appears in search results, comparisons, or recommendations. Before reaching out, they research your company reputation. They find negative reviews describing poor service or unresolved issues. They quietly eliminate you from consideration and contact competitors instead.
Critical insight: This prospect never enters your measurement systems. They don't appear in your CRM. Your marketing analytics show a website visit but no conversion. Your sales team never knows they existed.
From your perspective, nothing happened. From the prospect's perspective, negative reviews eliminated you from consideration before you had a chance to compete.
This pre-contact filtering is why businesses often don't realize reputation is affecting pipeline quality until they analyze conversion trends over extended periods.
Attribution Challenges Make Causality Difficult to Prove
When prospects do engage despite negative reviews, the friction manifests in ways hard to attribute specifically to reputation:
Sales teams report: "Prospects are asking more questions about service quality." "We're getting more requests for customer references." "Deal cycles seem longer than they used to be." "Price negotiations are tougher."
These symptoms have reputation components, but they're rarely attributed to reputation in CRM notes or lost deal analysis because sales teams don't know what research prospects conducted before first contact.
The Gradual Accumulation Problem
Unlike acute business problems (equipment failure, regulatory violation, major customer loss), reputation damage accumulates gradually:
Month 1: A few negative reviews appear. Impact is negligible.
Month 3: More reviews accumulate. Conversion rate declines 2%. Leadership attributes it to market conditions.
Month 6: Patterns become visible to prospects researching you. Conversion down 5%. CAC increasing. Still attributed to competitive dynamics.
Month 12: Systematic reputation issues. Conversion down 10-15%. Sales cycles 20% longer. Now clearly a problem, but difficult to reverse quickly.
By the time impact is obvious enough to trigger concern, the damage has been compounding for months and requires sustained effort to reverse.
Multiple Contributing Factors Obscure Reputation's Role
Business performance is affected by many variables simultaneously: market conditions, competitive dynamics, product changes, pricing adjustments, marketing effectiveness, sales team performance, seasonal factors.
Reputation damage occurs alongside these other variables, making it difficult to isolate reputation's specific contribution to performance changes without controlled analysis.
This is why understanding whether negative reviews are hurting your business requires looking at multiple indicators rather than expecting a single obvious signal.
What Sales Teams Experience (Even When They Don't Realize It's Reputation)
Sales teams are often the first to feel reputation friction, but they rarely attribute it correctly because the connection isn't obvious.
Increased Objection Handling Requirements
When negative reviews create doubt, prospects enter sales conversations with pre-existing concerns that require addressing:
Common objections influenced by reputation research:
- "We saw some concerning reviews about your customer service. Can you address that?"
- "How do you handle situations when things go wrong?"
- "Can you provide references from customers in our industry?"
- "What's your process for resolving customer complaints?"
Sales teams handle these objections, but often don't recognize they're symptoms of reputation concerns prospects discovered independently.
More Trust-Building Required Before Commitment
What this looks like operationally:
- More discovery calls needed before moving to demonstration
- More stakeholders requiring involvement in decision
- More reference calls requested
- More requests for trial periods or pilot programs
- More legal review of contract terms around service levels
Each additional trust-building step extends sales cycles and reduces team productivity (fewer deals closed per period).
Higher Discount Pressure to Overcome Risk Perception
When prospects perceive vendor risk based on negative reviews, they compensate by demanding pricing concessions:
Pricing dynamics affected by reputation:
- "Given the service concerns we've seen, we'd need a significant discount."
- "We'll need better terms to offset the risk."
- "Your competitors are offering better pricing" (because they don't have reputation discount).
The result is margin erosion that appears as pricing pressure but stems from reputation-driven risk perception. This connects directly to why silence on public complaints damages brand credibility in competitive situations.
Higher Lost Deal Rates in Final Stages
Perhaps most frustrating for sales teams: losing deals late in the process after significant investment in the opportunity.
Common late-stage loss patterns:
- Procurement team discovers negative reviews during final due diligence
- Executive stakeholder does independent research and raises concerns
- Legal or risk management flags reputation issues in vendor evaluation
- Board or committee votes against vendor selection citing service concerns
These losses are particularly costly because they occur after substantial sales effort has been invested.
Where Reputation Impact Shows Up in Your Metrics
While reputation damage may not announce itself clearly, it creates measurable changes in business metrics when you know where to look.
Conversion Rate Trends (The Clearest Signal)
Conversion rate, the percentage of website visitors or inquiries that become customers, is often the most sensitive indicator of reputation impact.
What to analyze:
- Conversion rate trend over 6-12 months
- Comparison to historical baseline (same period previous year)
- Segment analysis (do conversion rates decline more in segments where buyers do more research?)
- Competitive comparison if available (are competitors' conversion rates stable while yours decline?)
Red flag pattern: Steady decline in conversion rates (2-5% per quarter) despite stable or increasing traffic, without corresponding product, pricing, or market changes.
Example:
- Previous baseline: 3.5% of website visitors request quote
- Current rate: 2.8% of website visitors request quote
- 20% decline in conversion efficiency
- Same traffic volume means 20% fewer opportunities entering pipeline
- Attribution analysis shows no other significant variables changed
This pattern strongly suggests reputation friction is filtering prospects before engagement.
Customer Acquisition Cost Trends (The Hidden Tax)
Ombudsman Scrutiny: Industry ombudsman services monitor public complaint patterns. High volumes of unresolved complaints about similar issues can trigger proactive investigations.
Regulatory Examination: Regulators increasingly use public information as risk indicators. Systematic complaint patterns may influence examination priorities or licensing reviews.
Consumer Protection Enforcement:The National Consumer Commission can investigate businesses showing patterns of CPA violations visible through public complaints.
Litigation Risk: Public complaints create discoverable evidence in consumer litigation. Patterns of similar complaints strengthen class action viability or regulatory enforcement cases.
Operational and Strategic Impact
Customer Acquisition Cost (CAC), total sales and marketing expense divided by new customers acquired, increases when reputation creates friction.
Why CAC increases with reputation damage:
- More marketing spend needed to generate same inquiry volume (prospects eliminate you earlier in research)
- More sales touchpoints required per closed deal (more trust-building needed)
- Lower close rates mean fixed sales costs spread across fewer wins
- Discounting reduces revenue per customer while acquisition cost stays constant
What to analyze:
- CAC trend over 12-24 months
- CAC by customer segment (enterprise vs. mid-market vs. small business)
- Components of CAC (marketing cost per lead vs. sales cost per win)
- CAC relative to customer lifetime value (CAC ratio deterioration)
Red flag pattern: Increasing CAC without corresponding product complexity increases or market changes, particularly if marketing cost per lead is stable but sales conversion efficiency is declining.
Sales Cycle Length (The Velocity Indicator)
Average sales cycle length, time from first contact to closed deal, extends when reputation creates additional friction.
Why cycles lengthen:
- More stakeholders require involvement due to perceived risk
- More reference calls and due diligence needed
- More committee reviews and approval layers
- More negotiation on terms and pricing
What to analyze:
- Average days-to-close trend over 12-24 months
- Segment analysis by deal size and customer type
- Stage-by-stage duration to identify where delays occur
- Comparison to industry benchmarks if available
Red flag pattern: Steady increase in sales cycle length (15-30 days longer) without corresponding deal complexity increases, particularly if delays concentrate in final decision stages.
Win Rate Trends (The Competitive Indicator)
Win rate, percentage of qualified opportunities that close as wins, declines when reputation creates competitive disadvantage.
Why win rates decline:
- Prospects choose competitors with better reputation signals
- Price sensitivity increases, making wins require unsustainable discounting
- Late-stage competitive research favors competitors with fewer complaints
- Enterprise procurement eliminates vendors with reputation red flags
What to analyze:
- Win rate trend over 12-24 months
- Lost deal analysis for cited reasons
- Win rate by sales stage (early vs. late stage losses)
- Competitive win rate (wins against specific competitors)
Red flag pattern: Declining win rates particularly in competitive evaluations, with lost deal feedback citing "service concerns," "reputation issues," or "selected vendor with better customer satisfaction ratings."
Many businesses don't systematically track lost deal reasons, but starting this practice often reveals reputation as a significant factor leadership wasn't aware of.
Revenue Growth Deceleration (The Lagging Indicator)
Revenue growth rate, the ultimate business metric, eventually reflects accumulated reputation damage.
Why growth decelerates:
- Conversion rate decline reduces new customer acquisition
- CAC increase reduces marketing efficiency and ROI
- Sales cycle extension reduces deal velocity
- Win rate decline reduces percentage of pipeline converting
What to analyze:
- Revenue growth rate trend vs. historical baseline
- Growth rate vs. market growth rate (are you losing share?)
- Growth rate vs. traffic/inquiry growth (is efficiency declining?)
- New customer acquisition rate vs. historical baseline
Red flag pattern: Decelerating growth despite stable or increasing marketing investment, with efficiency metrics (conversion, CAC, win rate) all deteriorating simultaneously.
Revenue deceleration is a lagging indicator, by the time it's clearly visible, reputation damage has been accumulating for 6-12 months. This is why treating online reputation as a business risk requires monitoring leading indicators rather than waiting for revenue impact.
Qualitative Signals That Indicate Reputation Impact
Beyond quantitative metrics, qualitative signals often reveal reputation friction before it shows up clearly in numbers.
Sales Team Feedback Patterns
When sales teams consistently report certain patterns, it often indicates reputation-driven friction:
Common feedback indicating reputation impact:
- "Prospects are doing more research before engaging with us."
- "We're getting questions about negative reviews we saw online."
- "Customers are asking for more references than they used to."
- "Procurement teams are raising service quality concerns."
- "We're losing deals to competitors we should be beating on product."
- "Price negotiations are tougher, everyone wants discounts now."
Individual instances might be random, but consistent patterns across multiple sales reps signal systematic issues.
Customer Reference Requests and Outcomes
Changes in reference request patterns can indicate reputation concerns:
Patterns suggesting reputation friction:
- Increase in number of reference calls requested per deal
- More specific questions about service quality and problem resolution
- Prospects asking "have you ever had complaints?" or similar
- Reference checks earlier in sales cycle than historically normal
Marketing and Lead Quality Observations
Marketing teams may notice changes in lead behavior:
Indicators of reputation-driven changes:
- Lower engagement rates with content after initial website visit
- More time spent on "about us" and "reviews" pages before conversion
- More direct questions about service quality in contact forms
- Lower response rates to outbound outreach
Customer Success and Renewal Patterns
Existing customer behavior can reveal reputation concerns:
Warning signs from customer base:
- Customers mentioning negative reviews they've seen
- Questions about whether service quality is declining
- More cautious approach to expansion or upsell conversations
- Renewal negotiations becoming more difficult
These qualitative signals don't prove reputation impact conclusively, but they provide context for quantitative metrics and often appear before numerical trends become statistically significant.
How to Conduct a Reputation Impact Assessment
Rather than guessing whether negative reviews are hurting your business, conduct a systematic assessment to determine actual impact.
Step 1: Audit Your Online Reputation
Before assessing impact, establish baseline reputation state:
What to review:
- Hellopeter company profile and complaint patterns
- Google Business reviews and rating
- Industry-specific review platforms relevant to your sector
- Social media mentions and sentiment
- News articles or media coverage
Key metrics to capture:
- Total number of negative reviews/complaints
- Average rating across platforms
- Percentage of complaints with company response
- Common themes in negative feedback
- Severity and recency of issues
Pattern recognition:
- Are negative reviews isolated incidents or systematic patterns?
- Do reviews describe similar issues repeatedly?
- Has review volume or negativity increased over time?
- How does your reputation compare to direct competitors?
This audit establishes whether you have a reputation issue that could be affecting business performance.
Step 2: Analyze Performance Metrics
Pull 12-24 months of data for key performance indicators:
Metrics to analyze:
- Website traffic to inquiry/lead conversion rate
- Lead to opportunity conversion rate
- Opportunity to closed deal win rate
- Average sales cycle length
- Customer acquisition cost
- Revenue growth rate
- Customer segment trends (which segments declining?)
Analysis approach:
- Calculate trend lines to identify deterioration patterns
- Compare current period to same period previous year
- Segment analysis to identify where impact concentrates
- Correlation analysis between reputation changes and metric changes
Questions to answer:
- Which metrics show deterioration?
- When did deterioration begin?
- Does timing correlate with reputation changes?
- Are some customer segments more affected than others?
Step 3: Gather Qualitative Intelligence
Systematically collect feedback from customer-facing teams:
Sales team survey/interview questions:
- What objections are you hearing more frequently?
- How often do prospects mention online reviews?
- What questions are you getting about service quality?
- How have reference requests changed?
- What reasons are you hearing in lost deals?
Customer success team questions:
- Are customers mentioning negative reviews?
- How have renewal conversations changed?
- What concerns are customers raising?
- Has upsell/expansion become more difficult?
Marketing team questions:
- How has lead behavior changed?
- What content resonates vs. what's being ignored?
- How are engagement metrics trending?
This qualitative data provides context for quantitative trends and often reveals reputation impact before metrics show clear statistical significance.
Step 4: Conduct Competitive Comparison
Assess your reputation performance relative to competitors:
Comparison points:
- Your review volume and ratings vs. top 3 competitors
- Your response rate to complaints vs. competitors
- Your complaint resolution rate vs. competitors
- Common themes in your reviews vs. competitor reviews
Strategic questions:
- Do competitors have similar issues but handle them better?
- Are competitors' reputation advantages enabling better pricing?
- Can you quantify market share shifts correlating with reputation differences?
Competitive context helps determine whether your situation is industry-standard or a specific disadvantage.
Step 5: Calculate Financial Impact
Translate findings into financial terms leadership understands:
Impact calculations
Conversion leakage:
- If conversion rate declined 3%, multiply traffic volume by baseline conversion rate vs. current
- Difference = opportunities lost to reputation friction
- Multiply by average deal value = revenue impact
CAC increase:
- If CAC increased 15%, calculate excess cost per customer acquired
- Multiply by number of new customers = total excess acquisition cost
Sales cycle extension:
- If cycles lengthened by 30 days, calculate carrying cost per opportunity
- Multiply by number of deals = productivity loss cost
Win rate decline:
- If win rate dropped 10%, calculate additional opportunities needed for same wins
- Multiply by cost per opportunity = wasted pipeline development cost
Total annual impact = sum of these components
This financial framing makes reputation impact concrete rather than theoretical.
Case Study: How Reputation Impact Became Visible
To illustrate how reputation impact manifests, consider this composite example based on common patterns.
Business profile:
- B2B software company, R50M annual revenue
- Enterprise and mid-market customers
- 18-month average sales cycle
- 12-person sales team
Reputation situation:
- 47 negative reviews accumulated over 2 years on Hellopeter
- Average 2.8 stars (competitors averaging 4.1 stars)
- 0% response rate to complaints (silent on all negative reviews)
- Common themes: poor implementation support, unresponsive customer service, billing issues
Initial leadership perspective: "We have some complaints but every business does. Our customers seem happy once implemented."
What analysis revealed
Metric analysis:
- Website-to-inquiry conversion: declined from 4.2% to 3.1% (26% drop)
- Opportunity-to-close win rate: declined from 28% to 21% (25% drop)
- Average sales cycle: increased from 16 months to 21 months (31% increase)
- CAC: increased from R42,000 to R63,000 per customer (50% increase)
Qualitative findings:
- Sales team reported increasing questions about service quality (8 of 12 reps mentioned)
- Lost deal analysis revealed 40% cited "service concerns" or similar
- Three enterprise opportunities eliminated vendor after procurement review
- Two existing customers mentioned reviews when negotiating renewals
Financial impact calculation:
- Conversion leakage: R4.2M annual revenue loss
- CAC increase: R1.8M excess acquisition cost
- Sales cycle extension: R1.1M productivity loss
- Total impact: R7.1M annually (14% of revenue)
Leadership decision: Implemented systematic reputation management including public response protocols, service improvement initiatives, and customer success enhancements. Investment: R850,000 annually.
12-month results:
- Response rate increased to 95%
- Average rating improved to 3.9 stars
- Conversion rate recovered to 3.8%
- Win rate improved to 25%
- Estimated ROI: 8.4x in first year
This pattern, significant impact unrecognized until systematic analysis, is common across businesses of all sizes and sectors.
When Negative Reviews Aren't the Problem
Important caveat: Not all performance challenges stem from reputation issues. Sometimes reputation is blamed when other factors are responsible.
Alternative explanations for performance decline:
- Market saturation: Total addressable market shrinking or highly penetrated.
- Competitive disruption: New entrants with superior products or business models.
- Pricing misalignment: Your pricing no longer competitive with market alternatives.
- Product gaps: Competitors' offerings genuinely superior for target segments.
- Sales execution issues: Team skill, motivation, or process problems unrelated to reputation.
- Marketing effectiveness: Message, positioning, or channel strategy problems.
- Economic conditions: Macro factors affecting buyer budgets or priorities.
How to distinguish reputation impact from these alternatives:
If competitive losses cite service/reputation explicitly, it's reputation. If conversion declines but engagement metrics (time on site, content downloads) remain strong, likely reputation (people research but don't convert). If existing customers raise reputation concerns, it's affecting retention not just acquisition. If all efficiency metrics (conversion, CAC, win rate, cycle time) deteriorate simultaneously without other explanatory factors, reputation is likely contributor.
Proper analysis distinguishes reputation impact from other factors rather than attributing everything to reputation incorrectly.
The Risk of Ignoring the Signal
When leadership asks "are negative reviews hurting us?" and decides "probably not significantly," there's a risk of allowing small problems to become large ones.
The compounding nature of reputation damage:
Year 1: Few negative reviews. 2-3% conversion impact. "Not material enough to address."
Year 2: Reviews accumulate. Patterns visible. 5-7% conversion impact. "We should probably address this eventually."
Year 3: Systematic reputation issues. 10-15% conversion impact. Clear revenue impact. "We have a reputation crisis."
By Year 3, the problem is both more obvious AND more expensive to fix because: More negative reviews to address. Stronger market perception of poor service. Competitor advantages established. Revenue impact affecting resources available for remediation.
The optimal intervention point is Year 1 when impact is small but preventable, not Year 3 when impact is large and harder to reverse. This is why treating online reputation as a business risk requiring proactive management is essential.
How to Present Findings to Leadership
If your analysis reveals reputation is affecting business performance, presenting findings effectively to leadership is critical.
Effective presentation structure:
- Executive summary: One-page overview with key findings and financial impact.
- Situation assessment: Current reputation state with competitive comparison.
- Performance impact: Metrics showing deterioration with trend analysis.
- Attribution analysis: Evidence linking reputation to performance changes.
- Financial quantification: Annual revenue and cost impact in specific terms.
- Recommended action: Specific initiatives with investment requirements.
- Expected outcomes: Projected improvements with timeline.
- Risk of inaction: What happens if issues aren't addressed.
Frame findings in business terms leadership cares about:
- Revenue growth impact
- Market share trends
- Competitive positioning
- Customer acquisition economics
- Sales productivity
- Enterprise deal progression
Avoid framing as "we have negative reviews" (perception problem) and instead frame as "reputation friction is creating R7M annual revenue drag" (business problem).
The Strategic Opportunity in Reputation Risk Management
While this blog frames online reputation as a risk, properly managed it becomes a competitive advantage.
Demonstrated Accountability Builds Trust
Businesses that engage openly with complaints signal organizational maturity, customer-centricity, and governance quality. In markets where many competitors avoid accountability, this differentiation is valuable.
Public Problem-Solving Demonstrates Competence
When prospects see your business acknowledging and resolving issues publicly, they gain confidence in your ability to handle problems when they arise, which builds trust more effectively than claiming perfection.
Complaint Intelligence Drives Improvement
Public feedback provides unfiltered market intelligence about product gaps, service failures, and operational weaknesses. Companies that systematically act on this intelligence improve faster than competitors ignoring the signal.
Reputation Excellence Enables Premium Positioning
In mature markets, reputation for reliability and customer accountability supports premium pricing and reduces price-based competition. Customers pay for demonstrated trustworthiness.
Key Takeaways
Online reputation is a material business risk requiring executive oversight and systematic management. Reputation risk manifests across sales, regulatory exposure, enterprise relationships, and strategic positioning. South African regulatory and cultural context elevates reputation from perception to compliance concern.
Systematic complaint patterns signal operational and governance weaknesses requiring attention. Managing reputation risk requires visibility, accountability, response protocols, and operational integration. Public engagement with complaints demonstrates organizational maturity and controls narrative risk. Reputation risk, properly managed, becomes competitive advantage through demonstrated accountability.
Conclusion
Online reputation is no longer a soft metric managed by marketing teams. It is a compounding business risk that requires the same systematic oversight, measurement, and management as financial risk, operational risk, or compliance risk.
For South African businesses operating in an environment of high consumer rights awareness, regulatory scrutiny, and digital transparency expectations, the cost of treating reputation as secondary concern continues to increase.
The businesses that recognize reputation as a core risk discipline, establishing visibility, accountability, and systematic response protocols—will build sustainable competitive advantage through demonstrated trustworthiness.
The alternative is allowing reputation to deteriorate until it materially constrains growth, increases operational costs, and creates regulatory exposure that could have been prevented through systematic engagement.
The question for executive leadership is not whether to manage online reputation risk, but whether to manage it proactively before it constrains business outcomes, or reactively after it already has.
Ready to manage reputation as a business risk? Explore Hellopeter for Business to gain visibility into your public reputation and establish systematic response protocols.
Disclaimer:
This article is for informational purposes only and does not constitute legal, financial, or professional advice. HelloPeter makes no warranties regarding the accuracy or completeness of the information provided. Readers should conduct independent research and consult qualified professionals before making financial decisions. HelloPeter is not liable for any losses or damages arising from reliance on this information or interactions with third-party businesses. Consumer reviews on www.hellopeter.com represent individual opinions and should be considered alongside other sources when evaluating businesses.
RELATED ARTICLES
How to Request a Review Update: From Complaint to Resolved

Why Black Friday Customer Experience Beats The Discounts
How Super Communications Got to Rank #1 in 3 Industries on Hellopeter
UP NEXT
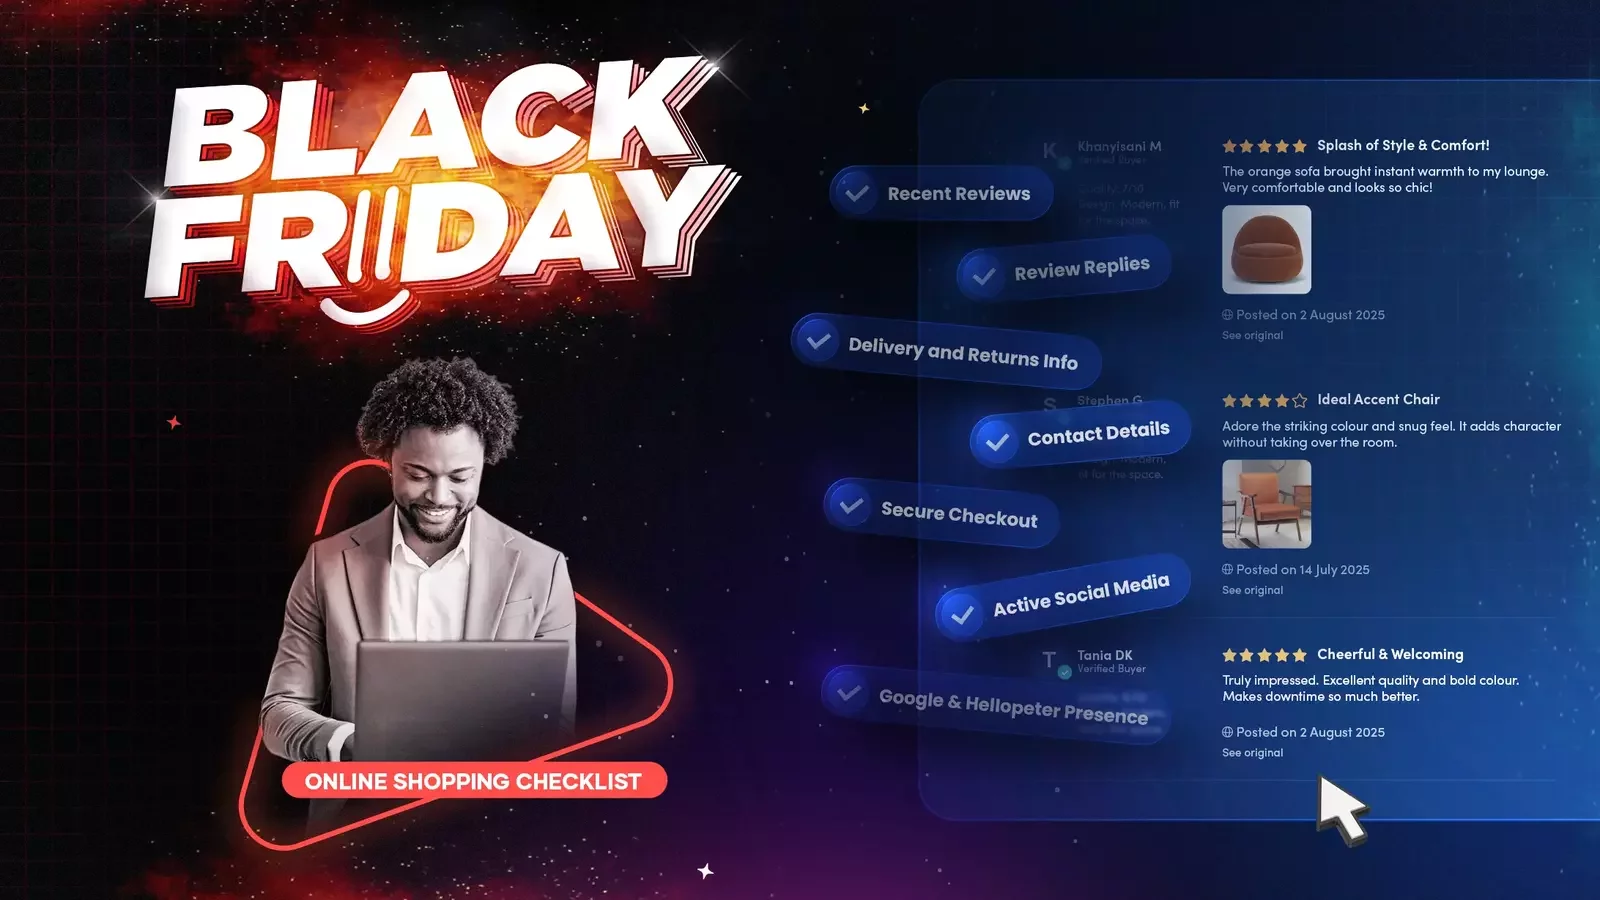
7 THINGS CUSTOMERS CHECK ONLINE BEFORE BUYING FROM YOU THIS BLACK FRIDAY